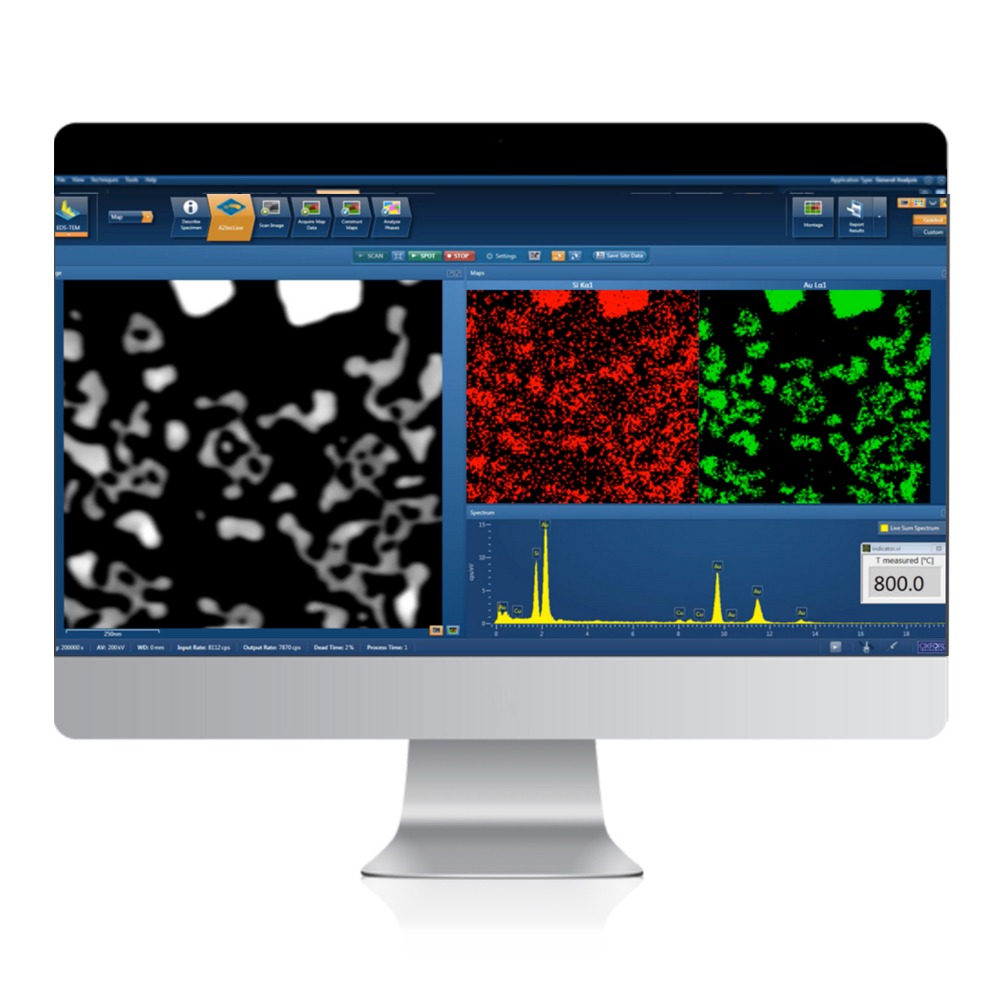
AZtecTEM is an innovative EDS software specifically optimised for advanced TEM applications.
AZtecTEM is a unique system approach to the characterisation of materials at the nanoscale. Building on over 30 years of Oxford Instruments’ experience in TEM technologies, AZtec is everything you should expect of a next-generation EDS system for TEM.
Powerful
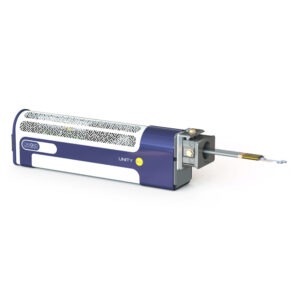
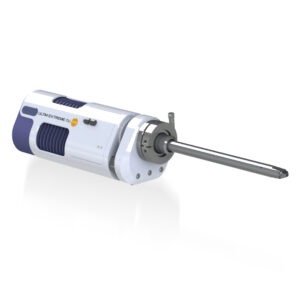
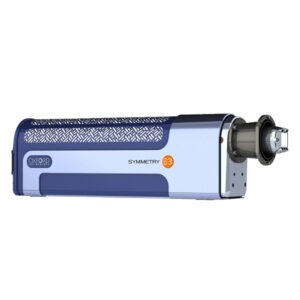
Unleashes the potential of the latest generation of large area Ultim Max TEM SDDs – delivering sensitivity when count rates are low and a high capacity when count rates are high.
Choice of detectors, including 100 mm2 active area with a special design that maximises solid angle. Multiple detector systems enable over 2 sr solid angle (TEM and configuration dependent)
Windowless options for outstanding low-energy performance
AZtec has a 64-bit performance and a true multi-tasking capability, so you work at the maximum detector speed, visualise final results in real-time, report in parallel and get the job done faster than ever
Flexible
AZtecTEM provides the tools to explore data in your own way with a variety of options for data collection, processing and export
Accurate
- Incorporates Tru-Q® technology to provide high accuracy AutoID and quantitative analysis – so you get the right results in real-time, time after time
- AutoLock™ provides a unique blend of predictive and reactive drift correction routines – vital when working at the nano and atomic scales
- TruMap® and TruLine™ correct for overlaps and other artefacts in real-time, then automatically visualise the data in the best way possible
Structured
- Guided or custom operating modes
- AZtecTEM can assist any level of user from start to finish with Step Notes and editable Standard Operating Procedures
- Fast
- Acquire at the maximum detector speed, visualise final results in real-time, and report in parallel
Qualitative and Quantitative Analysis
- Qualitative Analysis in the TEM: Real-time analysis and reporting
Point & ID
Often, the first step in analysing the sample is. With AZtec, this is fast, accurate and reproducible – you simply select the areas to analyse, then, in the short time it takes to collect a spectrum:
- All elements are automatically identified
- The composition is displayed in the unique miniQuant window
- You can quickly annotate points of interest for others to note …and send your mini-report to others with a single click
AutoID
Accurate and reliable, AutoID allows users to identify peaks in real-time as spectra are being collected during the scan.
- No need to know which elements are present beforehand
- Exclude elements from the analysis, if required
- Uses Tru-Q technology to correctly identify elements at all count rates – even where peaks overlap
AutoLock
Automatically keep the field of view locked to the same area. This is of special relevance to STEM when collecting high-resolution images and maps.
- Enables analysis at resolutions that are normally difficult to achieve because of drift
- Provides live updates of corrective actions being taken
- A unique blend of predictive and reactive correction routines copes with different types of drift
Quantitative Analysis in the TEM: Providing the accuracy for real-time quant analysis
Tru-Q®
Tru-Q is a unique Oxford Instruments technology that provides high accuracy AutoID and quantitative analysis. It uses a combination of technologies:
- Complete detector and hardware characterisation for a true standardless analysis
- Robust FLS spectrum processing that works in all situations. For example, there is no need for any background fitting adjustment
- Modified Cliff-Lorimer – TEM quant that allows sample thickness and density to be taken into consideration
- Theoretical or user-defined k-factors can be applied
- K, L or M lines can be chosen for quantitative analysis
- PPC – Automatic correction for pulse pile-up at high count, making accurate quant at 200,000 cps a reality
- Removal of unwanted non-sample peaks (e.g. Cu from the grid)
Now everyone can achieve reliable results
EDS Mapping for TEM
Spectral mapping should be a central tool of every EDS system – it is with AZtec
Smart Mapping
SmartMap spectral mapping brings the benefits of automatic qualitative analysis into two dimensions to identify elements and visualise their distributions.
The traditional ‘Windows Integral’ mapping method
- Maps are automatically generated
- Elements may also be manually defined
- Mapping resolution up to 4k pixels
- All the information is saved at every pixel for post-processing
AutoLayer
At the click of a button, AutoLayer takes the often complex information contained in a set of X-ray maps and turns it into a single image that helps visualise both phase and element distribution in the specimen.
- Instantly and automatically interprets your specimen
- Colours automatically selected to highlight what’s important in a single image
- Unravels the complexity of real specimens
EELS Integration
Superfast EELS integration delivers accurate simultaneous data acquisition. AZtec is capable of working at speeds well in excess of 1000 spectra per second.
- Seamless integration with Digital Micrograph™
- Fastest acquisition possible
- Easy switching between integrated and stand-alone modes.
- Highest EDS collection efficiency
TruMap
TruMap is a unique real-time mapping solution that removes background and peak overlaps on the fly.
- Eliminates erroneous data automatically
- Corrects overlaps such as:
- Si K and W M lines – vital to the semiconductor industry
- Pb M, Mo L and S K for minerals analysis
- Can be applied to legacy data
QuantMap
QuantMap displays real quantitative chemical X-ray maps by recalculating SmartMap data to correct for X-ray background, peak overlaps, sample matrix effects and pile-up artefacts. QuantMaps can be calculated and displayed online – eliminating the need to reprocess SmartMap data offline.
Display results in atomic%, weight%, oxide% or atomic concentration
Export data to a spreadsheet
AutoPhaseMap
AutoPhaseMap creates a phase map of the specimen using statistical measures to optimise phase groupings rather than clustering or principal components. It provides an unrivalled qualitative and quantitative analysis of automatically identified phases.
Distribution of each phase
- Spectrum, composition and area fraction for each phase
- Finds phases for all size ranges, including nanomaterials
- Finds elements which are present in trace amounts
Linescan for TEM
LineScan brings the concepts of AZtec real-time acquisition and reporting to the study of linear variations
All the data is always collected and saved at every pixel
- Easy and flexible interpretation
- Automatically acquire multiple horizontal or vertical LineScans
- Align the image and LineScan for a clear visual comparison
- Normalised intensity scales make a comparison of major and minor elements simple
TruLine
TruLine incorporates Tru-Q technology to calculate true elemental peak variation from a line scan.
- Corrects for peak overlaps automatically
- Enhances real elemental differences by removing X-ray background variation
- Real-time calculation and display
QuantLine
QuantLine displays real quantitative chemical linescans by recalculating SmartMap data to correct for the X-ray background, peak overlaps, sample matrix effects and pile-up artefacts.
- No need to wait for lengthy data processing…see quantitative linescans live!
- Display results in atomic%, weight%, oxide% or atomic concentration
- Export data to a spreadsheet
- Can work on legacy datasets
- Data processing and export
- Flexible off-line data processing and data export
Reconstruction
Maps, linescans and spectra may be reconstructed from previously collected SmartMap or Linescan data. This enables users to:
- Reconstruct TruMaps from previously collected SmartMaps
- Reconstruct QuantMaps from previously collected SmartMaps
- Reconstruct TruLines and QuantLines from previously collected Linescans
- Reconstruct spectra from areas and points on maps or linescans
- Variable-thickness linescans can be extracted from stored map data for detailed analysis of grain boundaries
Data Transfer
In (S)TEM, it is often desirable to transfer data collected in AZtec to other programmes for further investigation. AZtec gives the capability to transfer data as:
Data cubes in the form of raw files to programmes such as Lispix and multivariate statistical analysis packages for the evaluation of data, such as atomic column mapping
Excel for further processing of spectra (EMSA format), maps and linescans
Usability and Reporting
Usability: powerful for the expert – yet scalable to any user
Multi-Tasking
AZtec has true multi-tasking capability, meaning that every second of data acquisition can also be used for processing and reporting.
- Data interaction in real-time
- Many tasks that used to take minutes now take seconds
- Interrogate data from one project while acquiring data for a new project
- Enable new ways of working to give a large increase in productivity
Multi-user environments
- Profiles contain all the settings required to repeat an analysis and obtain the same results, no matter who the user is
- Step Notes and Standard Operating Procedures (SOPs) help at every step of your analysis and can be easily modified for personalised SOPs
Operating Modes
- Guided Mode: Ideal for those who prefer a ‘step-by-step’ approach to analysis. Each step of the Navigator has a clear purpose. You can always see what is happening and what to do next
- Custom Mode: Ideal for those who prefer the freedom and flexibility to decide what functionality they want to see and where they want to see it
Reporting
No matter what your requirements are, AZtec will help you present the reports you need in the format you want. Fast: reporting direct from the interface – a simple right click and data can be emailed directly to your customer
- Flexible: a dedicated application enables you to export your data in the format and resolution you want
- Structured: a comprehensive list of report templates tailored to each application enables you to print a professional report with a single button press
- Create your own templates
- Simple easy-to-use interface
- Create templates for use across multiple techniques
- Create multi-page templates
- Create templates for single or multiple users